#05: Pie chart - School Spending
The charts below show the percentage of total spendings of a school in UK in 1981, 1991 and 2001
Summarise the information by selecting and reporting the main features and make comparisons where relevant.
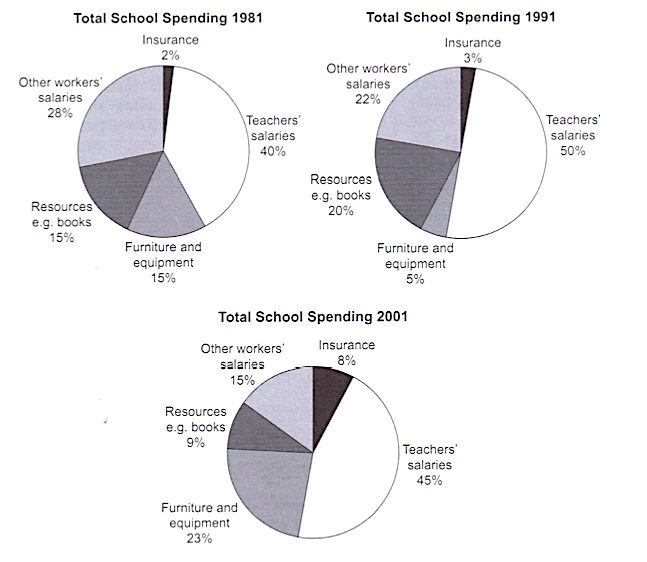
The pie charts compare the expenditure of a school in the UK in three different years over a 20-year period.
It is clear that teachers’ salaries made up the largest proportion of the school’s spending in all three years (1981, 1991 and 2001). By contrast, insurance was the smallest cost in each year.
In 1981, 40% of the school’s budget went on teachers’ salaries. This figure rose to 50% in 1991, but fell again by 5% in 2001. The proportion of spending on other workers’ wages fell steadily over the 20-year period, from 28% of the budget in 1981 to only 15% in 2001.
Expenditure on insurance stood at only 2% of the total in 1981, but reached 8% in 2001. Finally, the percentages for resources and furniture/equipment fluctuated. The figure for resources was highest in 1991, at 20%, and the proportion of spending on furniture and equipment reached its peak in 2001, at 23%.
Word count: 158 words
Thầy Simon - Nguồn: https://ielts-simon.com/ielts-help-and-english-pr/2014/10/ielts-writing-task-1-pie-charts-essay.html