Line graph (biểu đồ đường) - Luyện IELTS Miễn Phí - Results from #10

Luyện tập viết IELTS Writing task 1

Làm bài IELTS Writing Task 1 online và nhận kết quả chấm bài chi tiết trong vòng 48h đồng hồ.

Bạn có thể xem mẫu kết quả sửa bài của 

> Mẫu sửa bài IELTS Writing Task 1

> Mẫu sửa bài IELTS Writing Task 2

Nào hãy lựa chọn 1 trong các chủ đề bên dưới để bắt đầu làm bài nhé

Viết IELTS Writing Task 1 - Be Ready IELTS - sửa bài trong vòng 48h đồng hồ


Line graph (biểu đồ đường)

Proportion of population aged 65 and over
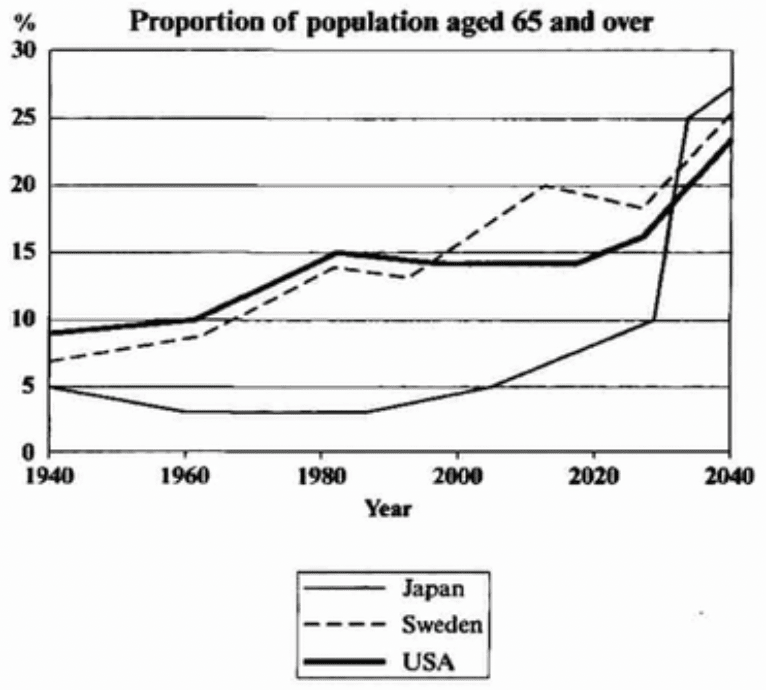
(Reading time: 1 - 2 minutes)

The graph below shows the proportion of the population aged 65 and over between 1940 and 2040 in three different countries.

Summarise the information by selecting and reporting the main features and make comparisons where relevant.

Làm bài

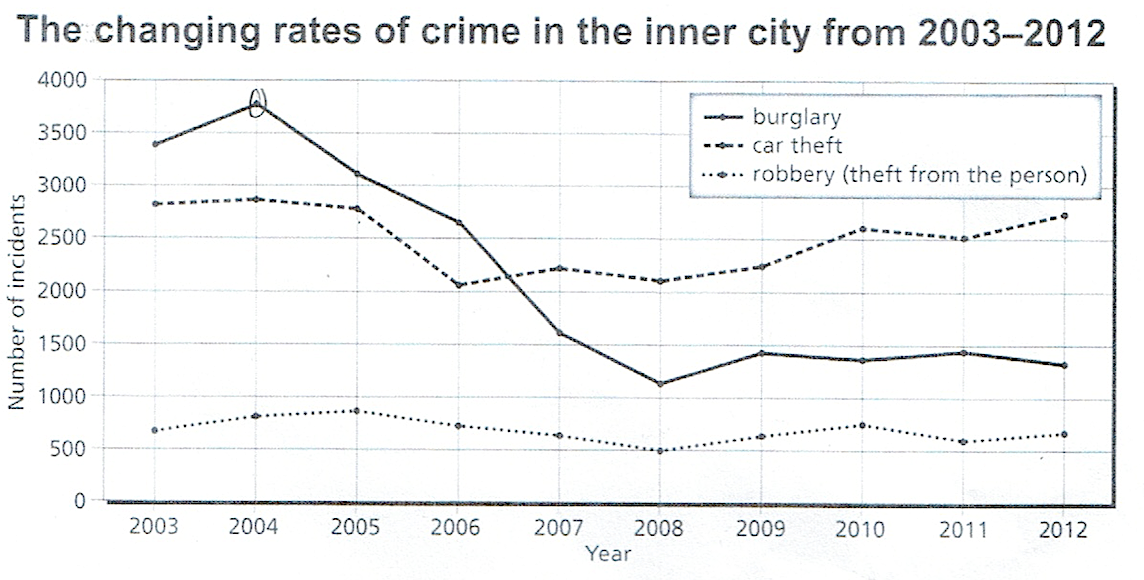
Crime rates in Newport city

(Reading time: 1 - 2 minutes)

The chart below shows the changes that took place in three different areas of crime in Newport City centre from 2003 - 2012.

Summarise and information by selecting and reporting the main features and make comparisons where relevant.
Làm bài

.

Liên Kết Chia Sẽ

Nhà Tài Trợ

Log in

Notice: Trying to access array offset on value of type null in /home/bereadyielts/public_html/templates/gk_university/layouts/blocks/tools/login.php on line 21
" /> create an account