Sample answer
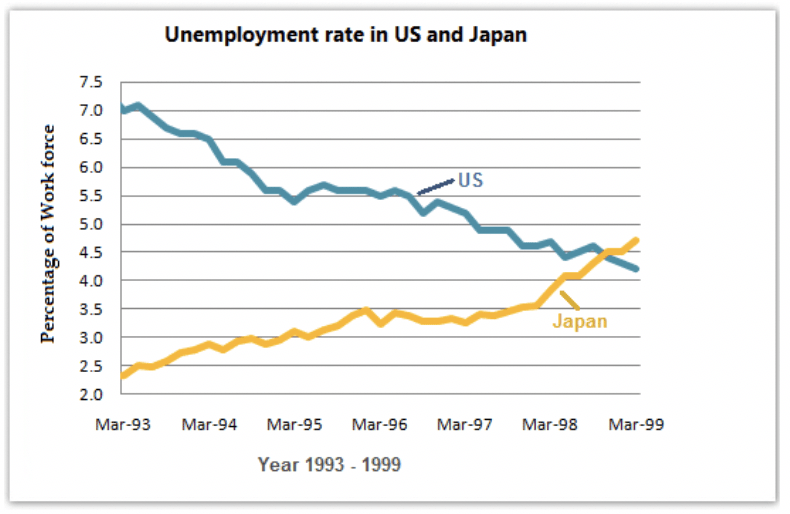
The chart gives information about the unemployment rates in Japan and the United States from March 1993 to March 1999.
Overall, the two countries experienced contrasting trends, in which unemployment rate fell in the US while that of Japan rose. It is noticeable that both countries had similar rates by 1999.
At the start of the period, there was a marked difference in unemployment rates in the two countries. More precisely, only 2.3% of the Japanese workforce was unemployed while 7% of the US labour force was out of work. Thereafter, unemployment in the US fluctuated in a downward trend, reaching a low of just over 4% in March 1999. With regard to Japan, its figure also showed fluctuations and had risen to around 4.7% in the final year shown in the graph, which was twice as high as its rate during 1999. The two countries achieved very similar rates of roughly 4.5% in March 1998, after which both countries’ rates changed in different trends. While the Japanese workforce continued increasing its unemployment rate, that of the US witnessed a gradual decrease.
Count: 179 words.