Visitors to Parkway Hotel
(Reading time: 1 - 2 minutes)
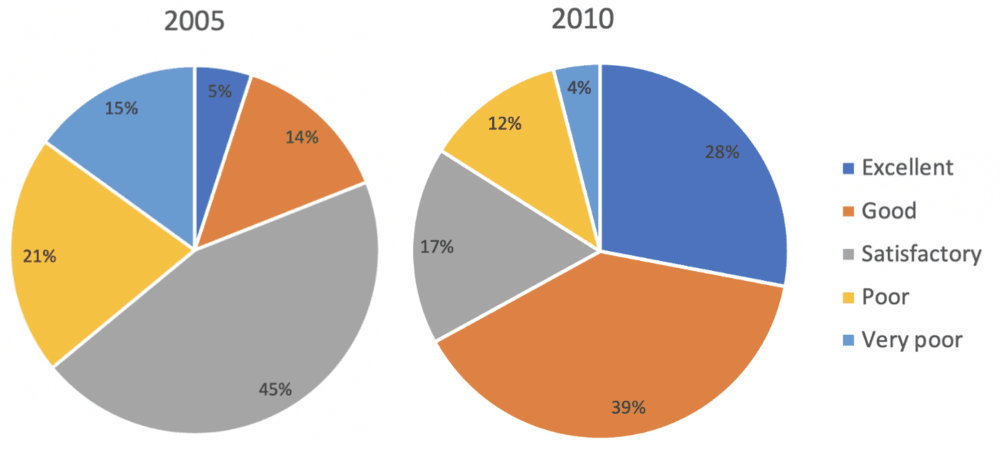
The charts below show the results of a questionnaire that asked visitors to the Parkway Hotel how they rated the hotel’s customer service in the years 2005 and 2010.

Bạn có thể xem mẫu kết quả sửa bài của
> Mẫu sửa bài IELTS Writing Task 1
> Mẫu sửa bài IELTS Writing Task 2
Nào hãy lựa chọn 1 trong các chủ đề bên dưới để bắt đầu làm bài nhé

The charts below show the results of a questionnaire that asked visitors to the Parkway Hotel how they rated the hotel’s customer service in the years 2005 and 2010.
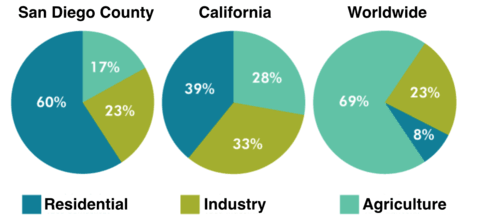
The pie charts below compare water usage in San Diego, California and the rest of the world.
Summarise the information by selecting and reporting the main features and make comparisons where relevant.
Write at least 150 words
Đề ngày 10/02/2018:
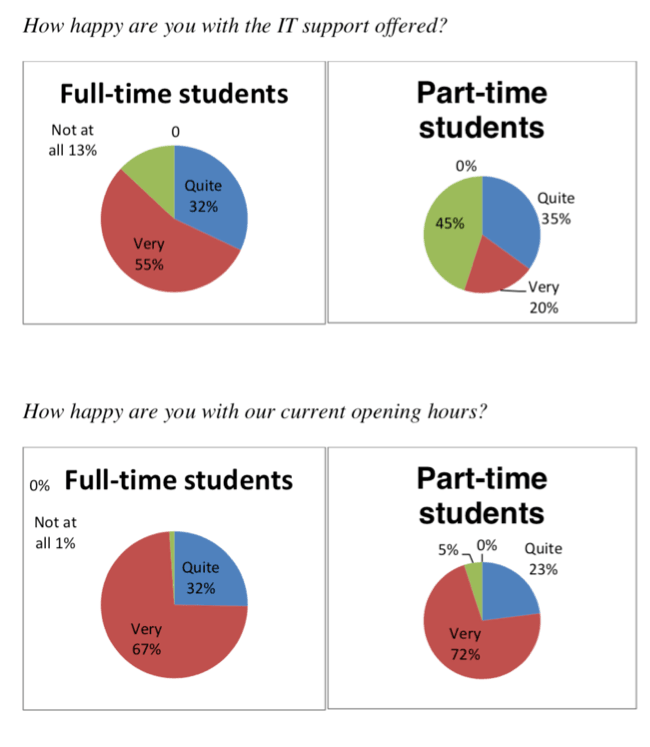
The charts below show the results of a survey conducted by a university library to find out opinions of full-time and part-time students about its services.
Summarise the information by selecting and reporting the main features and make comparisons where relevant.
Write at least 150 words
Đề ngày 24/5/2018
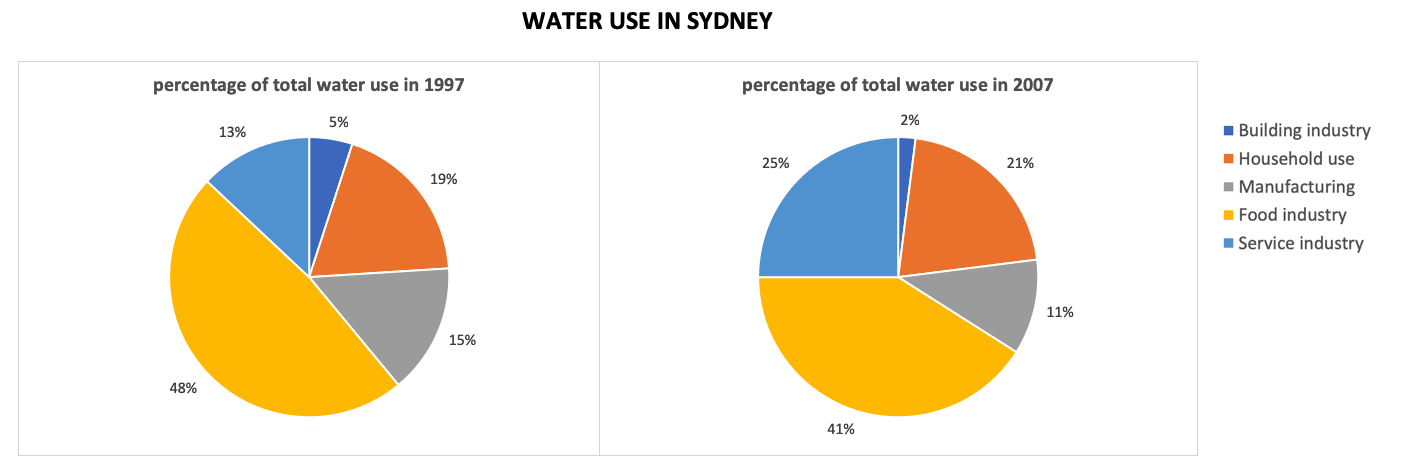
The charts below show the percentage of water used by different sectors in Sydney, Australia, in 1997 and 2007.
Summarise the information by selecting and reporting the main features and make comparisons where relevant.
Write at least 150 words
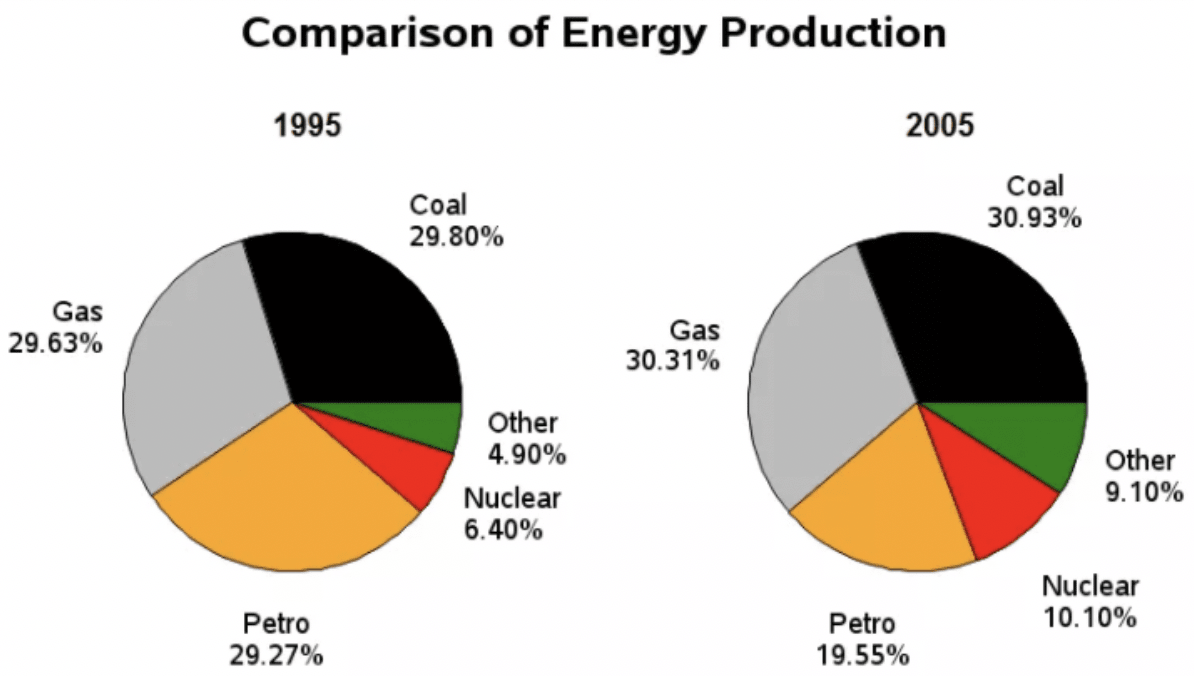
The pie charts below show the comparison of different kinds of energy production in France in two years.
Summarise the information by selecting and reporting the main features, and make comparisons where relevant.
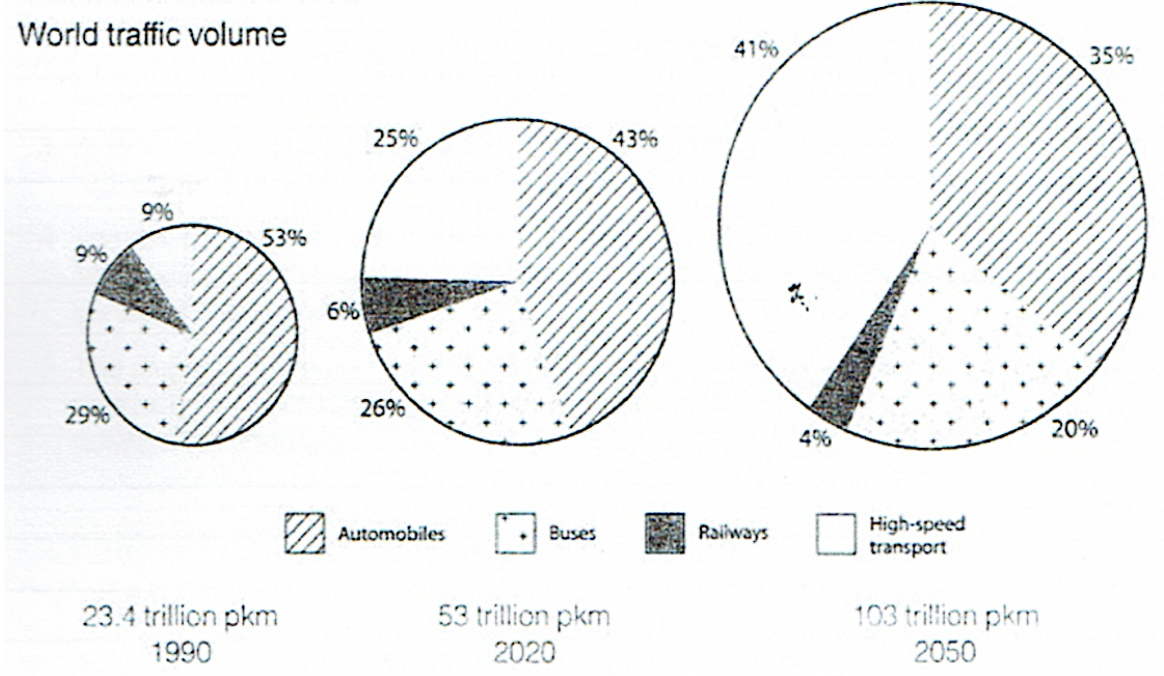
The charts below show the world traffic volume measured in passenger-kilometre-miles.
Summarise the information by selecting and reporting the main features, and make comparisons where relevant.
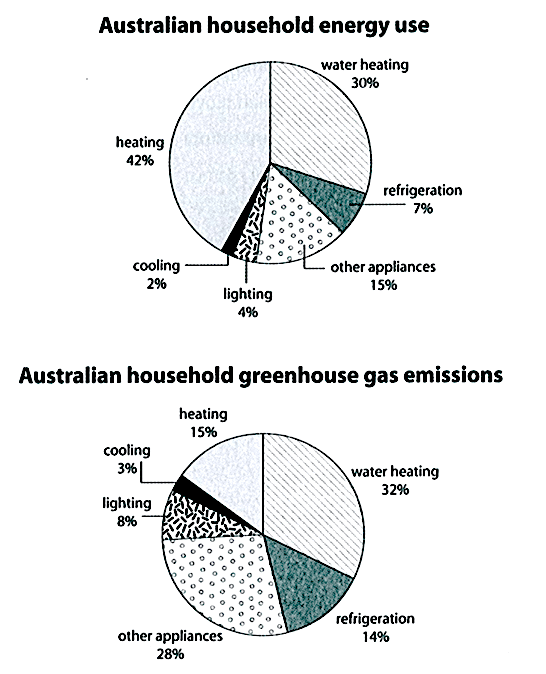
The first chart below shows how energy is used in an average Australian household. The second chart shows the greenhouse gas emissions which result from this energy use.
Summarise the information by selecting and reporting the main features and make comparisons where relevant.
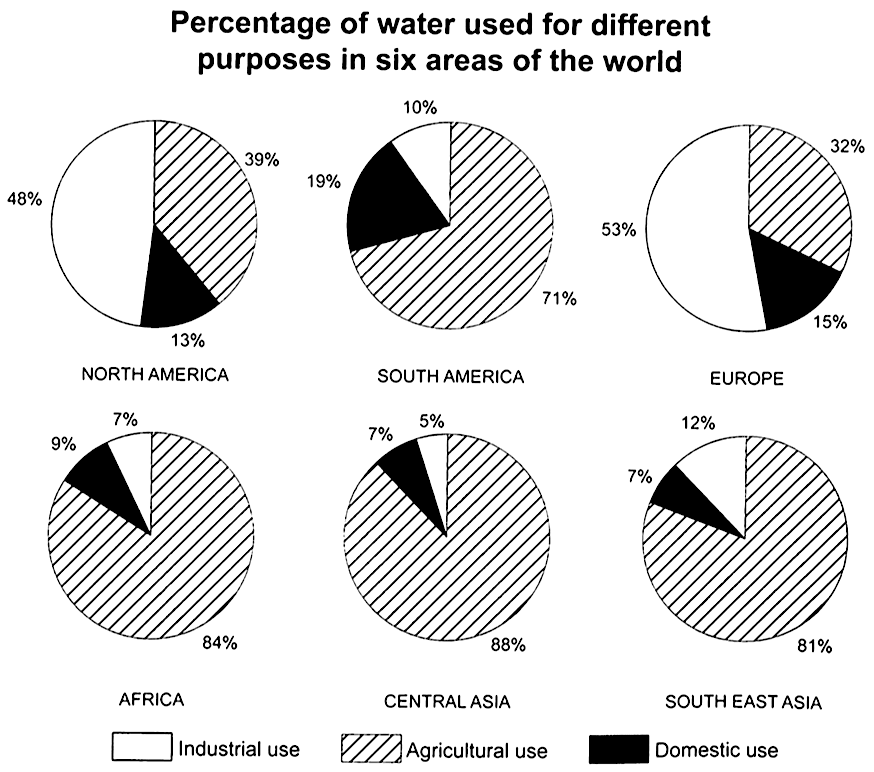
The charts below show the percentage of water used for different purposes in six areas of the world.
Summarise the information by selecting and reporting the main features and make comparisons where relevant.