Sample answer
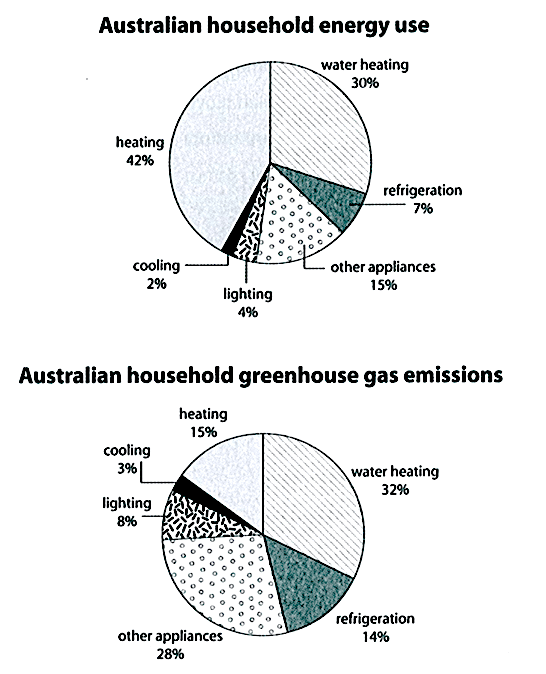
The first pie chart gives information about the proportions of energy consumption in an average Australian household. Accordingly, the second pie chart illustrates the percentages of greenhouse gas produced by energy uses.
Overall, most of the energy in an average household in Australia is used for heating, but the majority of greenhouse gas emission comes from water heating and household appliances. The amounts of greenhouse gas generated from using refrigeration and other appliances are approximately twice as high as their percentage of energy consumption.
It is clear from the charts that heating makes up the largest proportion of household energy use in Australia with 42%, as opposed to only 15% of greenhouse gas produced by this usage. In contrast, almost a third of the energy consumed by an Australian household is used for water heating (30%) and there is a similar figure for greenhouse gas emitted by this usage (32%). The figures of other appliances and refrigeration uses have the same tendency, in which the quantities of greenhouse gas generated (28% and 14% respectively) are around twice as much as the amounts of energy used (15% and 7% respectively).
Only a small minority of energy is used for cooling and lighting, accounting for 2% and 4% respectively. These two usages also constitute the two lowest proportions of greenhouse gas emission with 3% and 8% in the same order as mentioned.
Word count: 230 words.
Giáo viên Be Ready IELTS - Ms Thi