Bài học Writing Task 1 hôm nay chúng ta tìm hiểu về dạng bài Pie Chart nhé. Đây là một trong những dạng bài hay gặp trong Writing nha. Các bạn hãy bắt đầu bài học bằng cách xem video từ đầu đến cuối nha.
Sample
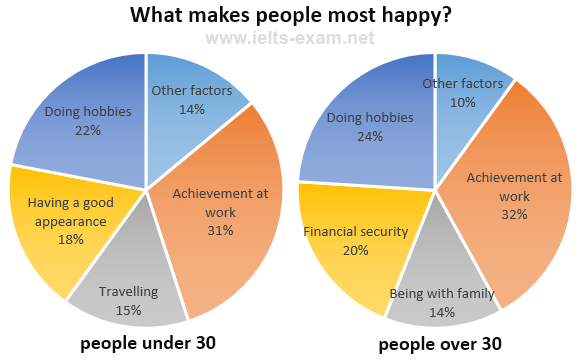
The chart below shows the results of a survey about what people of different age groups say makes them most happy.
Summarise the information by selecting and reporting the main features, and make comparisons where relevant.
Write at least 150 words. (nguồn ielts-exam.net).
Viết bài Writing Task 1 Pie Chart
1. Introduction
The chart below shows the results of a survey about what people of different age groups say makes them most happy.
Paraphrase:
- The chart -> The pie charts
- Shows -> Illustrate
- The results of a survey -> The outcome of a survey
- What people of different age groups say makes them most happy
-> Factors contributing to a happy life from the different aged groups
Full introduction:
The pie chart illustrates the outcome of a survey conducted to find out factors contributing to a happy life from the different aged groups
2. Overview
- Give the noticeable features between the two chart
- Overall, charts show Achievement at work sector has the highest proportion of happiness in the both age groups. Besides, people who just under 30 feels happy if they can travel and have a good looking while people who over 30 tend to satisfy with their life when they gather with their family and have financial security.
3. Body
Body 1:
- What is a similarity between two charts? Achievement at work
- How much does it account for in each? 31% for the younger and 32% for the older
| Similarity | Look at the similarities, A and B share the same pattern, |
| The biggest percentage | The biggest data largest + figure highest percentage proportion |
| 2 age groups | The former and the latter group Under 30 – age - group and over 30 – age - group The younger aged group and the older aged group |
- Looking at the similarities, for both younger and older people, the highest percentage says that achievement at work brings them most happiness: 31% for the former group and 32% for the latter group.
- What is the second factor that contributes the most to people’s happiness in both age groups? -> Doing hobbies
- Doing hobbies is also a noticiable factor triggering delighted feeling for both age groups mentioned with 22% and 24%
Body 2:
- What are the two main differences between two groups? Make comparisons where relevant
- For younger group: Having a good appearance and travelling
- For older group : Financial security và Being with family
| Comparative language | In contrast, On the other hand, Look at the differences, On the contrary, Contrarily, However |
| Neither A nor B... Neither of them... |
Many younger people regard having a good appearance and travelling significantly contribute to a happy life. In details, 18% of them state being good looking is essential for happiness while 15% who state that travelling leads to a fulfilled life. On the contrary, neither of having a good appearance and travelling is mentioned by the older aged group. Instead, a fifth of older people report that having financial security is most critical to their happiness and 14% say they feel most happy when they are with their family.
4. Full sample
The pie chart illustrates the outcome of a survey conducted to find out factors contributing to a happy life from the different aged groups.
Look at the similarities, for both younger and older people, the highest percentage says that achievement at work brings them most happiness: 31% for the younger age group and 32% for the older group. Doing hobbies is also a noticiable factor triggering delighted feeling for both age groups mentioned with 22% and 24% respectively.
Turning now to the differences, many younger people regard having a good appearance as extremely important: 18% of them states this brings them most happiness. This is followed by 15% who states that travel brings them happiness. Neither of these two factors is mentioned by older people. Instead, 20% of older people reports that having financial security is most important to their happiness and 14% says they feel most happy when they are with their family.
Các bạn lưu về luyện Writing Task 1 nhé!
Chúng ta luyện thêm với đề dưới đây nhé:
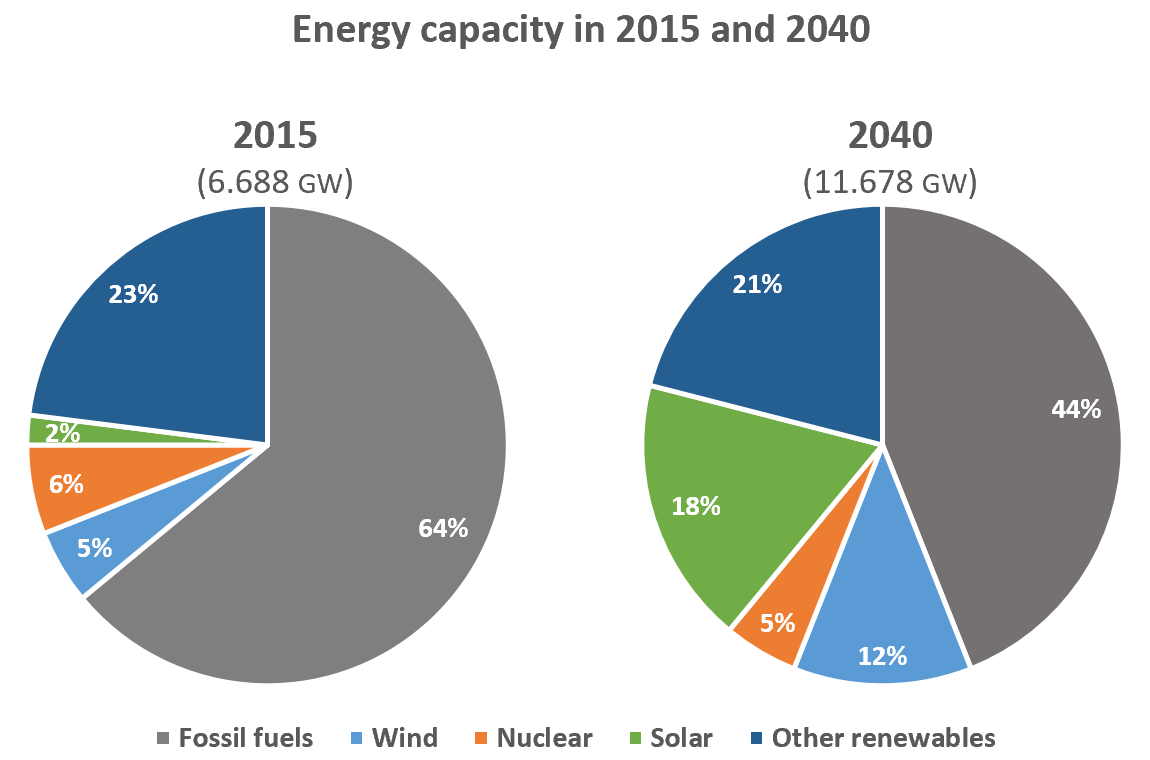
The pie charts below compare the proportion of energy capacity in gigawatts (GW) in 2015 with the predictions for 2040.
Summarize the information by selecting and reporting the main features, and make comparisons where relevant.
Write at least 150 words.
Analysis:
| Loại biểu đồ | pie chart |
| Nội dung | proportion/percentage of energy capacity |
| Thời gian | 2015-2040 -> quá khứ đơn, hiện tại, tương lai |
| Đơn vị | GW, %, percent |
| Đối tượng | fossil fuels, wind, nuclear, solar, and other renewables |
Brainstorm:
| Introduction | the pie charts depict/show/illustrate the percentage of energy capacity 2015 / and projections for 2040 |
| Overview | - projected energy capacity nearly doubles from … to … - fossil fuels remain the main/ major energy source - significant rise in solar and wind |
| Body 1 | Viết về sự thay đổi của fossil fuels and other renewables - highest proportion, at … - a decline by …% - a slight fall/drop (from … to…) |
| Body 2 | Viết về solar, wind, và nuclear energy - a dramatic rise in solar and wind (from…to) - a slight decrease, from … to |
Essay:
The pie charts below depict the percentage of energy capacity in 2015 with the projections for 2040.
Overall, it can be seen that the projected capacity almost doubles from 6.688 GW to 11.678 GW. The most noticeable feature from the chart is that fossil fuel, despite its decrease in the proportion of energy capacity, will remain a major energy source in 2040. Moreover, the significant rise in solar and wind energy capacity should not be overlooked.
In 2015, the proportion of energy capacity from fossil fuels was the highest, at 64%. However, this figure is projected to fall by 20% at the end of the period. In addition, the percentage of other renewables stood at 23% in 2015 and it will have a slight drop to 21% over the next 25 years.
In contrast, both wind and solar energy are predicted to witness a dramatic rise in the proportion of energy capacity. To be more specific, the figure for solar energy has a jump from 2% in 2015 to 18% in 2040 and that for wind will increase more than twofold, from 5% to 12%. Regarding nuclear energy, the projected proportion will be 5% in 2040, a slight decline from 6% in 2015.
Words: 205
Vocabulary and Collocations:
| the most noticeable feature | đặc điểm dễ dàng nhận ra nhất là |
| should not be overlooked | không nên bị bỏ qua |
| to be projected/predicted + to V-inf | dự đoán, được dự đoán rằng là |
| twofold (n) | gấp 2 lần |
| regarding sth | về phần |
Hy vọng với những bài viết trên đã giúp bạn nâng cao kỹ năng Viết bài Writing task 1 Pie Chart. Cùng luyện tập hàng ngày để nâng band điểm nhé.
Xem thêm:
Luyện tập cách viết Writing Task 1 dạng Table
Luyện tập cách viết Writing Task 1 dạng Line Graph