
Line Graph - biểu đồ đường là một trong những dạng biểu đồ thường gặp trong IELTS Writing Task 1. Hôm nay chúng ta cùng luyện tập cách viết biểu đồ này nhé!
Bạn cần xem hết video dưới đây và chuẩn bị bút giấy để ghi chú học hiệu quả nha.
Cách viết Writing Task 1 Line Graph
Chúng ta cùng học thông qua video hướng dẫn từ Ms Thanh để hiểu rõ về dạng bài Linegraph đồng thời mở rộng kiến thức, sau đó luyện viết theo hướng dẫn video tiếp theo bên dưới nhé.
Chúng ta cùng phân tích một đề bài và bắt đầu với các mục để viết Linegraph nhé.
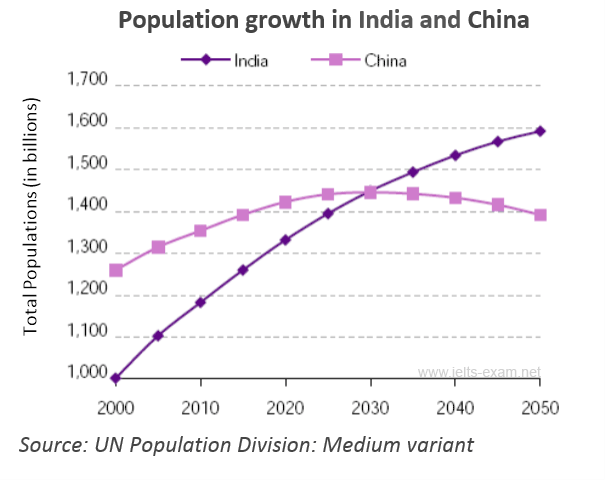
| The graph below shows population figures for India and China since the year 2000 and predicted population growth up until 2050. Summarise the information by selecting and reporting the main features, and make comparisons where relevant. Write at least 150 words
|
Introduction:
- Câu đề bài: The graph below shows population figures for India and China since the year 2000 and predicted population growth up until 2050
- Paraphrase:
The graph -> The line graph
shows -> expresses/illustrates/provides information about
Overview:
Trong vòng 50 năm từ năm 2000, dân số Ấn Độ sẽ tăng nhanh và vượt qua dân số Trung Quốc.
Over the 50-year period, India is going to experience steady growth in its population and it will overtake China.
Body:
Với loại biểu đồ này các bạn có thể chia phần Body làm 2 đoạn:
Đoạn 1: Miêu tả theo giai đoạn thời gian từ điểm bắt đầu (năm 2000) đến thời điểm hiện tại
- Trong năm 2000, số lượng người ở Trung Quốc nhiều hơn số người sống tại Ấn Độ
Cách viết:
| In + year, there + tobe + so sánh hơn + than | In 2000, there were more people living in China than in India. |
| Mệnh đề compared to/ with/ in comparison with + cụm N | In 2000, China’s population was much higher in comparison with India’s population. |
- Trong khoảng thời gian từ năm 2000 đến hiện tại, dân số Ấn Độ tăng 0.2 tỉ người trong khi dân số Trung Quốc tăng 0.1 tỉ người, nâng tổng dân số tại đây lên 1.35 tỉ.
Cách viết:
|
Trong khoảng thời gian từ năm 2000 đến hiện tại | From 2000 to the present Between 2000 and the present In the period between 2000 and 2020 During the time from 2000 to 2020 |
| S + V + adv | The number of Indian citizens has gone up significantly. |
| There + tobe + a + số liệu + N
There + tobe + a adj N | There has been a 0.2 billion rise in the number of Indian citizens. There has been a dramatic increase in the India’s population. |
| N + witnessed/ experienced/ saw + a adj N | The population of India witnessed a sharp growth. |
| Đồng thời | At the same time Over the same period While/ Meanwhile |
Đoạn 2: Miêu tả từ thời điểm hiện tại đến điểm kết thúc (năm 2050)
- Dân số ở Ấn Độ sẽ tăng nhanh hơn dân số Trung Quốc
Cách viết:
| S + will + V + adv
S + tobe + expected/ anticipated/ forecasted to + V + adv | The population in India will increase more quickly than in China. The population in India is expected to raise more quickly than in China. |
- Vào năm 2030, dân số Trung Quốc và Ấn Độ sẽ đều là 1.45 tỉ dân
- By 2030, both countries will have the same population at 1.45 billion.
- Dân số Trung Quốc chạm đỉnh vào năm 2030 và sẽ giảm nhẹ xuống 1.4 tỉ dân vào năm 2050. Trong khi đó, dân số Ấn Độ tăng dần đều và đạt đỉnh 1.6 tỉ dân vào năm 2050.
Cách viết:
| Đạt đỉnh | reach a peak hit/touch the highest point |
- The population of China hit the highest point in 2030, and then fell slightly to 1.4 billion in the next 20 years. Meanwhile, the number of Indian citizens increased moderately, followed by the highest point by 2050.
Bài mẫu:
| The graph shows how the population of India and China have changed since 2000 and how they will change in the future. Overall, over the 50-year period, India is going to experience steady growth in its population and it will overtake China. In 2000, there were more people living in China than in India. The number of Chinese was 1.25 billion, while India's population was about 1 billion. Between 2000 and the present, there has been a 0.2 billion rise in the number of Indian citizens. Over the same period, China's population has increased by 0.1 billion to reach over 1.35 billion. According to the graph, the population in India will increase more quickly than in China, and experts say that by 2030, both countries will have the same population of 1.45 billion. After this, China's population is likely to fall slightly to 1.4 billion in 2050, while India's population will probably increase and reach 1.6 billion. |
Phân tích luyện tập cách viết Linegraph
Video chữa đề 02 từ dự án chấm bài miễn phí của Ms Vân cũng là dạng Line Graph, các bạn theo dõi nhé:
Structure cấu trúc của một bài viết Task 1 với 4 đoạn, mở đầu, 2 đoạn giữa và kết thúc.
Video 1:
Step 1: Bắt đầu phân tích
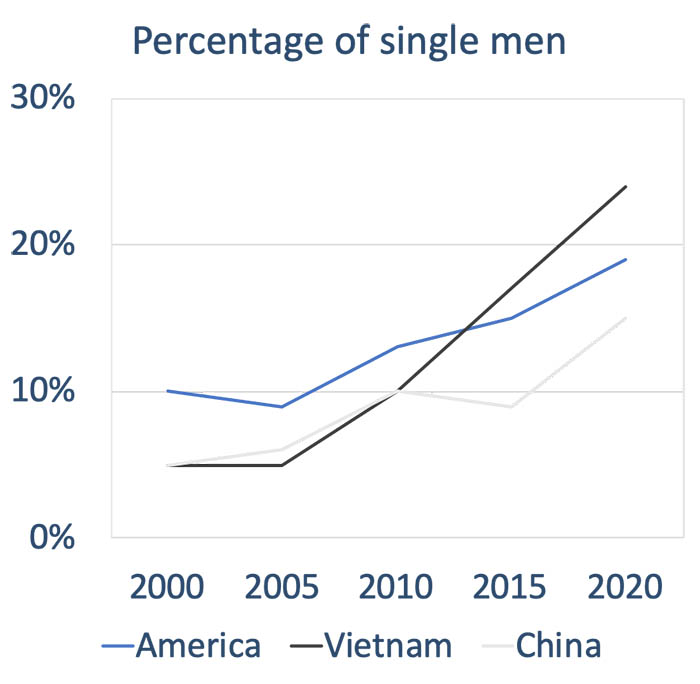
The graph shows the percentage of single men in America, Vietnam, China from 2000 to 2020.
Bạn phân tích:
Đối tượng là?
Trục Ox?
Trục Oy?
Step 2:
Sau đó ta có phân tích và paraphrase:
The graph shows the percentage of single men in America, Vietnam, China from 2000 to 2020.
in _____ of ________________________ (Oy)The graph ___________ /kəmˈperz/ ______________________ (đối tượng)
over a _________ period, ______________ (start) from
Introduction:
The given line graph compares ______________________ in terms of _______________________________ over ________________________________
Step 3:
✓
- Hai đường có xu hướng tăng, giảm, hay dao động?
→
✓
- Đường nào lớn hơn?
→
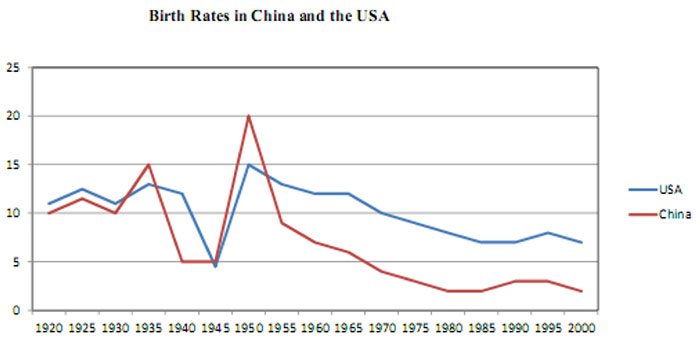
| __________ /ˌəʊvərˈɔːl/, it can (see) that both rates exp_r_enced a __________-ward trend during the period from 1920 to 2000. We can also see that although the two trends were similar in terms of __________ /dɪˈklaɪn/, the birth rate of the USA in most years was __________than that of China. |
Video bài học 2:
Step 1:
Chúng ta phân tích:

Body 1: China
+ 1920 – 1935:
+ 1940 – 1945:
+ 1950:
+ 1955:
+ 1980-2000:
Body 1
China’s birth rate ……………. from around 10 percent in the 1920s to 15 percent in 1935. Then it fell ……………. to around 5 percent in both 1940 and 1945. It ……………. rapidly to a ……………. of 20 percent in 1950. After this it fell ……………. to less than 10 percent in 1955. Finally, it ……………. ……………. to about 2 percent in 1980 and remained at this level until 2000.
Step 2: Phân tích để có body 2:
- Body 2: USA
+ 1920 – 1940:
+ 1945:
+ 1950:
+ 1960s:
+ 1980 - 2000:
Body 2:
Meanwhile, the US birth rate ……………. at around 12 percent from 1920 to 1940. It ………………. dramatically to under 5 percent in 1945. Next it …………….rapidly to a peak of about 15 percent in 1950. After 1950, it …………….gradually to about 12 percent in the 1960s and around 7 or 8 percent during the last 20 years of this period.
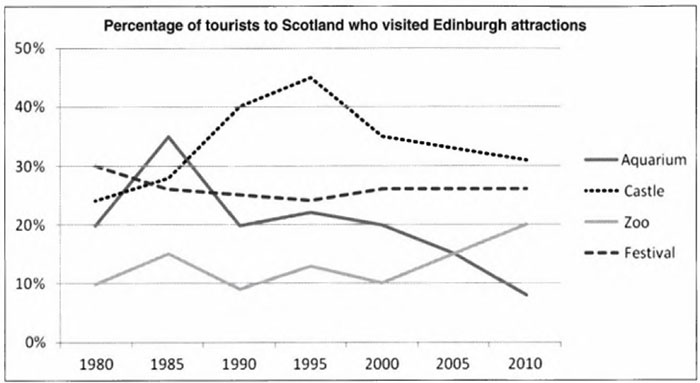
The line graph below shows the percentage of tourists to Scotland who visited four different attractions in Edinburgh

Step 1:
| The line graph below shows the percentage of tourists to Scotland who visited four different attractions in Edinburgh. |
→The ……………. line graph ……………………. the percentage of ……………. to certain places in Scotland namely Aquarium, Castle, Zoo and Festival from 1980 to 2010.
Step 2:
✓ Hai đường có xu hướng tăng, giảm, hay dao động?
→
✓ Đường nào lớn hơn?
→
| It is clear that while the percentage of tourists visiting Castle and Zoo ……………………. , the opposite was true for Aquarium and Festival over the period shown. It is also ……………………. that Castle was the most popular tourist attraction in Scotland for most of the period. |
Step 3:
Body 1:
→ In 1980, the percentage of visitors to Castle, which ……………………. at approximately 25%, was 2.5 times ……………………. than that to Zoo. During the period between 1980s and 1990s, the proportion of tourists visiting Castle increased dramatically and ……………………. a peak of 45% in 1995, before ……………………. declining to 30% in 2010. By contrast, before experiencing a rapid rise to 20% in the last year, the percentage of people visiting Zoo ……………………. around 10% from 1980 to 2000.
Body 2:
→In ……………………. of other places, in 1980, while there were 20% visitors to Aquarium, the figure for Festival stood at 30%. The period from 1980 to 1985 ……………………. a rapid rise in visitors to Aquarium to 35% and then the percentage steadily ……………………. to 10% in 2010. Meanwhile, the ……………………. of tourist who visited Festival fluctuated slightly but in general decreased moderately to 25% at the end of the period.
Các bạn cùng xem hết video và luyện tập nha!