Dàn bài IELTS Writing Task 1 dạng bài nhận xét biểu đồ cột
>>> Xem bài viết: "Cách nhận xét Pie Chart"
Để hiểu rõ cách làm, mời bạn đọc đề sau:
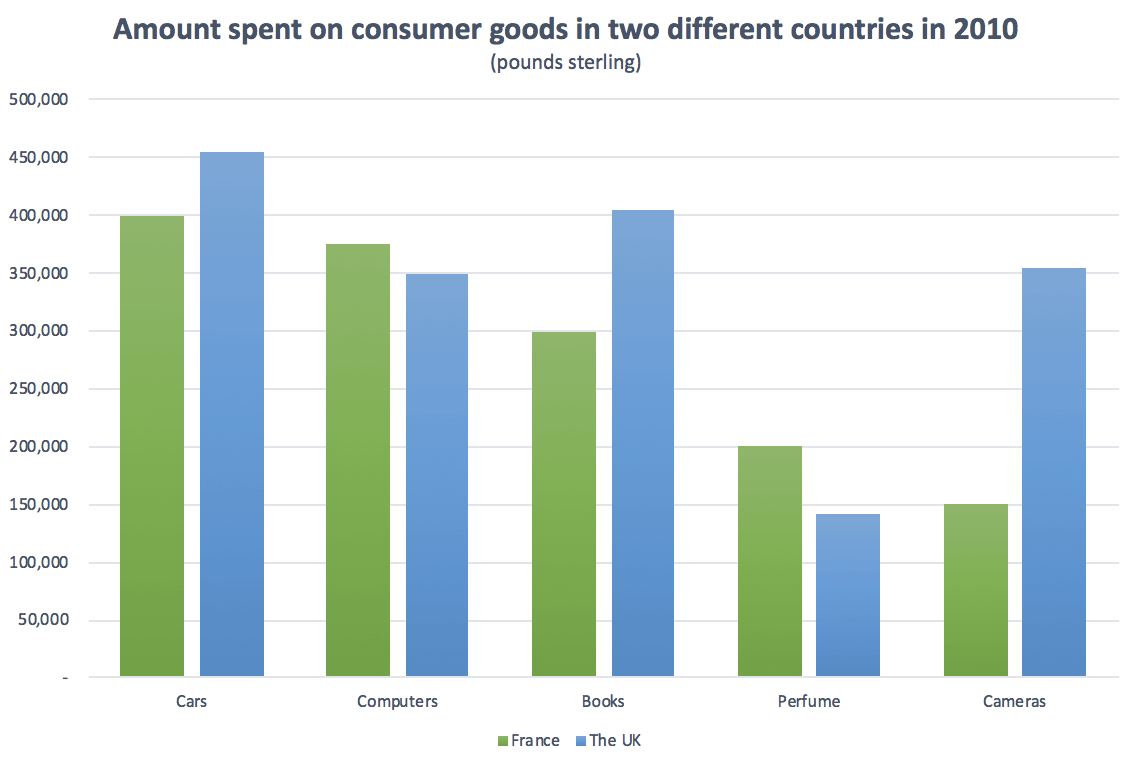
The bar chart below shows the expenditure that people in two different countries spent on consumer goods in 2010.
Summarise the information by selecting and reporting the main features and make comparisons where relevant.
Write at least 150 words

Bước 1: Quan sát & chọn lọc các key features
Khi thấy các biểu đồ tương tự như thế này, bạn quan sát 3 vị trí chính và đưa ra các nhận định như sau:
1) Trục chỉ đơn vị: là trục đưa ra các con số (có thể là trục tung hoặc trục hoành)
2) Trục chỉ các đối tượng được so sánh: là cột mà có các đối tượng được cung cấp số liệu, được đem ra so sánh. Trong trường hợp này là 5 đối tượng cars, computers, books, perfume, cameras.
3) Ô chú thích: chỉ các nhóm đối tượng. Trong trường hợp này có 2 nhóm là nhóm France và nhóm UK. Một quy tắc phải nhớ là đối với mỗi nhóm, chọn ít nhất 1 điểm nổi bật về để nói. Trong trường hợp này.
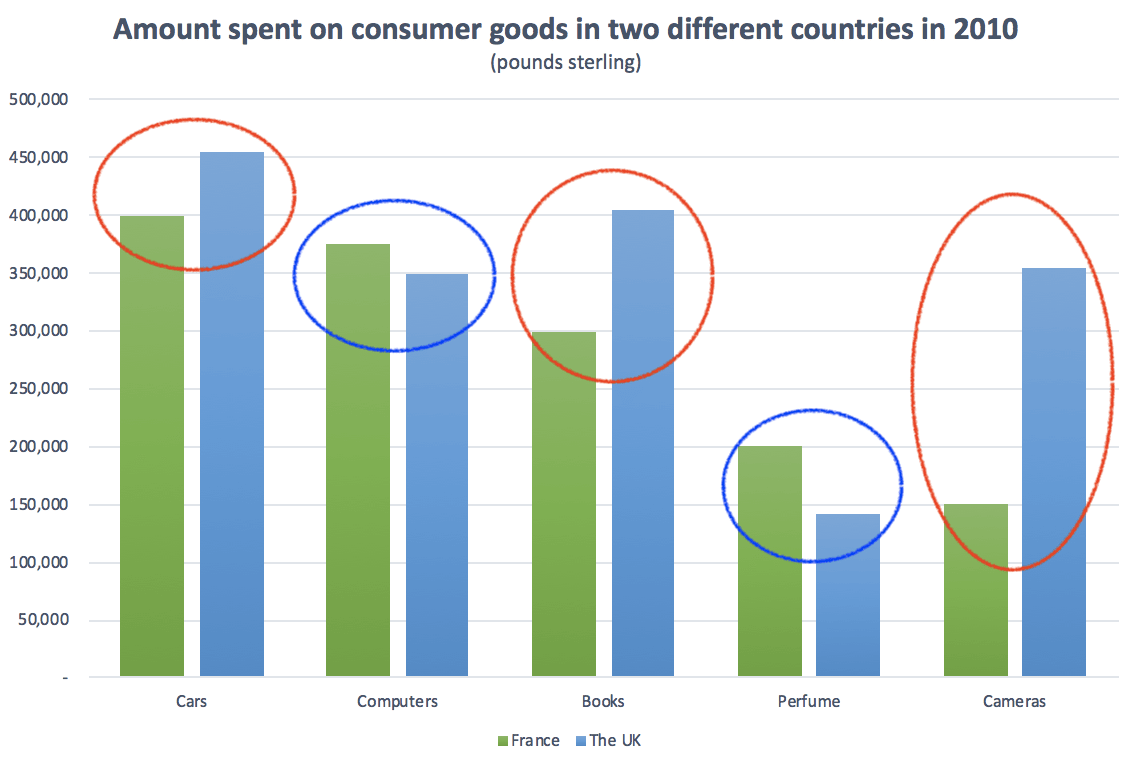
- The UK: tổng quan UK chi tiêu nhiều tiền hơn so với France (4/5 các cột xanh biển đều cao từ 350,000 trở lên). Các sản phẩm mà chi tiêu ở UK cao hơn France bao gồm: 1) cars (để đầu tiên do lớn nhất), 2) books (để thứ nhì) & 3) cameras (để sau cùng).--> Đây là hội nhà giàu.
- France: Các sản phẩm mà chi tiêu ở France cao hơn UK bao gồm 1) computers xuất hiện trước và 2) perfume xuất hiện sau --> Đây là hội nhà nghèo.

Bước 2: Lên dàn ý và sắp xếp các key features
| Introduction | Paraphrase lại đề bài |
| Overview (gom mỗi ý từ 2 sự phân tích trên) | Ý 1: UK chi tiêu nhiều tiền hơn cho các sản phẩm tiêu dùng so với France Ý 2: Cars được chi tiêu nhiều nhất ở cả France & UK, perfume được chi ít nhất ở UK, cameras được chi ít nhất ở France và đó cũng là thứ mà thể hiện sự chênh lệch lớn nhất giữa France và UK. |
| Body Paragraph 1 | Mô tả chi tiết ý 1 (tức hội nhà giàu) + đưa thêm số liệu |
| Body Paragraph 2 | Mô tả chi tiết ý 2 (tức hội nhà nghèo) + đưa thêm số liệu |
Bước 3: Viết bài
| Introduction | Paraphrase lại đề bài | The bar chart below =The chart shows = illustrates the expenditure that people in two different countries spent on consumer goods in 2010 = the amount of money spent on five consumer goods in France and the UK in 2010. Units are measured in pounds sterling. (câu này bạn có thể viết cũng được, không viết cũng không sao. Pound sterling tức là đồng bảng Anh, ký hiệu là £, nên trong bài viết bạn có thể viết £ cho gọn) |
| Overview (gom mỗi ý từ 2 sự phân tích trên) | Ý 1: UK chi tiêu nhiều tiền hơn cho các sản phẩm tiêu dùng so với France Ý 2: Cars được chi tiêu nhiều nhất ở cả France & UK, perfume được chi ít nhất ở UK, cameras được chi ít nhất ở France và đó cũng là thứ mà thể hiện sự chênh lệch lớn nhất giữa France và UK. | Overall, (ý 1) the UK spent more money on consumer goods than France in the period given. (ý 2) Both the British and the French spent most of their money on cars, whereas the least amount of money was spent on perfume in the UK and on cameras in France. |
| Body Paragraph 1 | Mô tả chi tiết ý 1 (tức hội nhà giàu) + đưa thêm số liệu. | In terms of cars, people in the UK spent about £450,000 on this as opposed to the French at £400,000. Similarly, the British expenditure was higher on books than the French (around £400,000 and £300,000 respectively). In the UK, expenditure on cameras (just over £350,000) was over double that of France, which was only £150,000. |
| Body Paragraph 2 | Mô tả chi tiết ý 2 (tức hội nhà nghèo) + đưa thêm số liệu. | On the other hand, the amount of money paid out on the remaining goods was higher in France. Above £350,000 was spent by the French on computers, which was slightly more than the British who spent exactly £350,000. Neither if the countries spent much on perfume which accounted for £200,000 of expenditure in France but under £150,000 in the UK. |
Toàn bộ bài mẫu như sau:
The chart illustrates the amount of money spent on five consumer goods in France and the UK in 2010. Units are measured in pounds sterling.
Overall, the UK spent more money on consumer goods than France in the period given. Both the British and the French spent most of their money on cars, whereas the least amount of money was spent on perfume in the UK and on cameras in France.
In terms of cars, people in the UK spent about £450,000 on this as opposed to the French at £400,000. Similarly, the British expenditure was higher on books than the French (around £400,000 and £300,000 respectively). In the UK, expenditure on cameras (just over £350,000) was over double that of France, which was only £150,000.
On the other hand, the amount of money paid out on the remaining goods was higher in France. Above £350,000 was spent by the French on computers, which was slightly more than the British who spent exactly £350,000. Neither if the countries spent much on perfume which accounted for £200,000 of expenditure in France but under £150,000 in the UK.
Count: 190 words, Cô Liz - Nguồn: http://ieltsliz.com/ielts-model-bar-chart-band-score-9/
Một bài mẫu khác của Thầy Simon nhận xét về Bar Chart without years mà rất đáng để tham khảo:
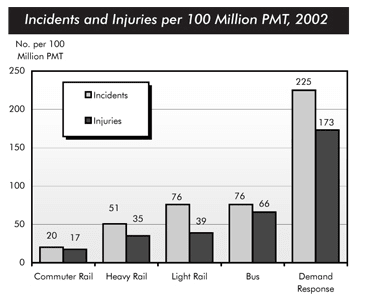
The chart below shows numbers of incidents and injuries per 100 million passenger miles travelled (PMT) by transportation type in 2002.

The bar chart compares the number of incidents and injuries for every 100 million passenger miles travelled on five different types of public transport in 2002.
It is clear that the most incidents and injuries took place on demand-response vehicles. By contrast, commuter rail services recorded by far the lowest figures.
A total of 225 incidents and 173 injuries, per 100 million passenger miles travelled, took place on demand-response transport services. These figures were nearly three times as high as those for the second highest category, bus services. There were 76 incidents and 66 people were injured on buses.
Rail services experienced fewer problems. The number of incidents on light rail trains equalled the figure recorded for buses, but there were significantly fewer injuries, at only 39. Heavy rail services saw lower numbers of such events than light rail services, but commuter rail passengers were even less likely to experience problems. In fact, only 20 incidents and 17 injuries occurred on commuter trains.
Word count: 165 words - Thầy Simon (https://ielts-simon.com/ielts-help-and-english-pr/2012/06/ielts-writing-task-1-chart-without-years-essay.html)
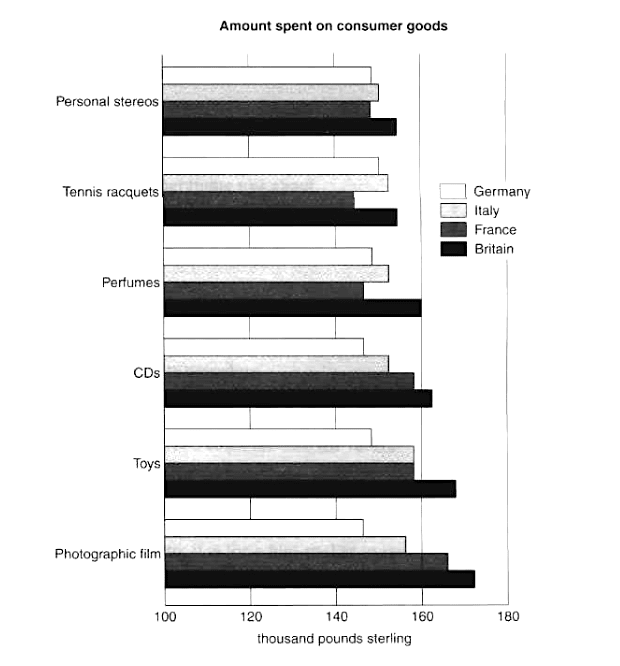
Như đã nói ở trên, có một số biểu đồ sẽ đổi vị trí thể hiện các đối tượng được so sánh, thường là để trục hoành nhưng giờ sẽ chuyển sang trục tung do số lượng khá nhiều. Ví dụ như biểu đồ dưới đây.

Với biểu đồ này bạn chắc chắn phải chọn lọc kỹ thông tin, số liệu chứ không thể nói hết tất cả vào bài viết. Áp dụng cách làm tương tự ở trên, bạn quan sát kỹ:
1) Trục chỉ các đối tượng được so sánh (trong trường hợp này là trục tung): ở đây có 6 đối tượng gồm photographic film, toys, CDs, perfumes, tennis racquets, personal stereo.
2) Ô chú thích: chỉ các nhóm đối tượng, gồm 4 quốc gia Britain, France, Italy, Germany. Một quy tắc phải nhớ là chọn ít nhất 1 điểm nổi bật về 1 quốc gia để nói, ví dụ:
- Britain: Có tổng chi tiêu cao nhất trong tất cả 6 mặt hàng, chọn số liệu của photographic film để nói do nổi bật nhất.
- France: Cao thứ nhì với 3 sản phẩm (photographic film, toys và CDs) nhưng thấp nhất với 3 sản phẩm còn lại.
- Italy: người Italian chi tiêu cho toys nhiều hơn so với chi tiêu cho các sản phẩm còn lại.
- Germany: Có tổng chi tiêu thấp nhất, số liệu chi tiêu của quốc gia này cho 6 mặt hàng đều khá giống nhau.
--> Trong trường hợp này khó có thể nhóm thông tin theo kiểu 'hội nhà giàu' vs 'hội nhà nghèo' do các quốc gia không thật sự nhiều để nhóm lại với nhau. Nếu gặp trường hợp như vậy, cách nhóm hay nhất là đưa các quốc gia cao nhất & thấp nhất vào 1 paragraph, các quốc gia còn lại vào paragraph còn lại. Ở đây ta sẽ nhóm Britain (cao nhất) & Germany (thấp nhất) đưa vào Body Paragraph 1. France & Italy sẽ vào Body paragraph 2.
Bạn thực hành viết nhận xét cho biểu đồ này nhé.
Thực hành viết bài và nhận phản hồi từ giáo viên Be Ready IELTS trong vòng 48h
Nếu muốn xem bài mẫu tham khảo cho biểu đồ này, bạn click vào link này >>> #01: Bar chart - Spending on consumer goods
Nếu muốn làm thêm các bài biểu đồ cột thể hiện so sánh khác, bạn click vào đây >>> Bài mẫu band 9 - Bar Chart
