Sample answer
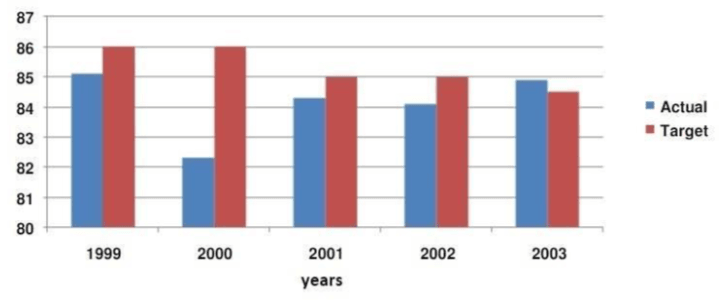
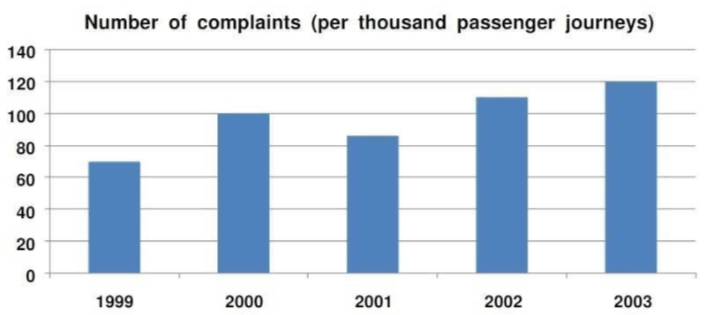
The first chart compares the percentage of bus services arriving on time with the target figure set by the company from 1999 to 2003. The second chart illustrates the number of complaints by passengers over the same period.
Overall, it is clear that in most years, the bus services failed to achieve the target figure for punctuality. In general, the number of complaints from passengers rose over the period.
In 1999, 85% of services arrived punctuality, almost equalling the target figure. However, the following year punctuality fell to around 82%, compared with the target of 86%. In the next three years, the proportion of bus services actually arriving on time fluctuated slightly from 84% to 85%. Only in 2003 did the bus company exceed its target of 84.5% punctuality.
The number of complaints per thousand passenger journeys was 70 in 1999. In 2000, this figure increased significantly to 100. In contrast, in 2001 the number of complaints then fell to around 85, before rising again to 110 and 120 in 2002 and 2003 respectively.