World traffic volume
(Reading time: 1 - 2 minutes)
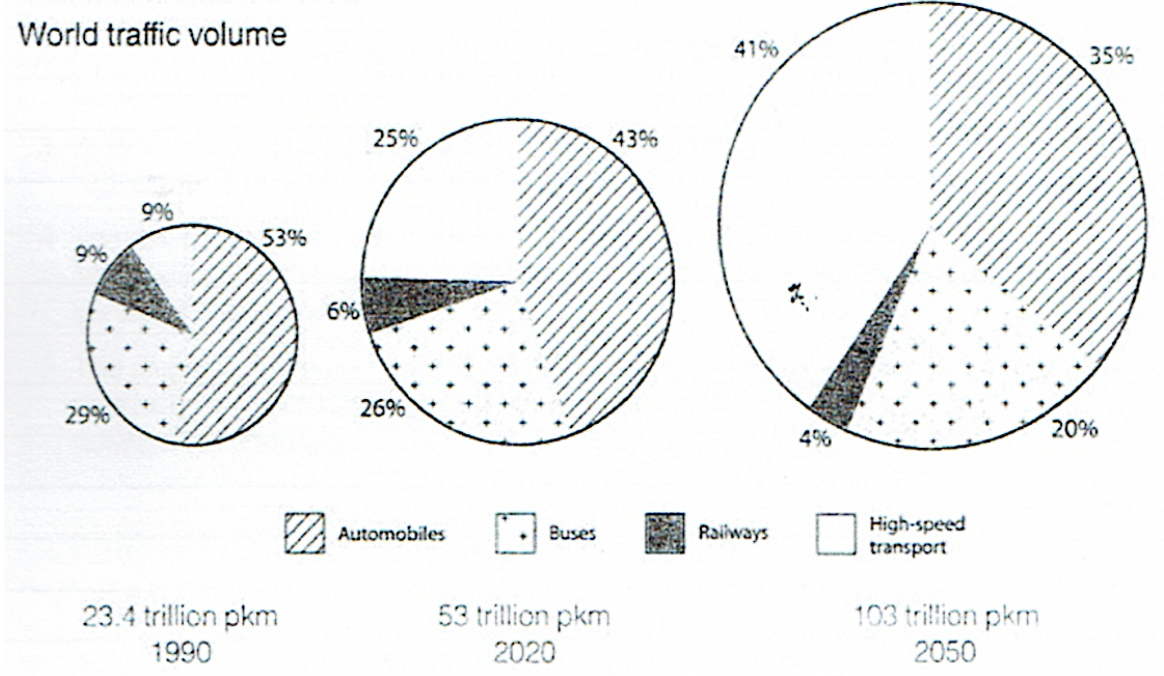
The charts below show the world traffic volume measured in passenger-kilometre-miles.
Summarise the information by selecting and reporting the main features, and make comparisons where relevant.

Bạn có thể xem mẫu kết quả sửa bài của
> Mẫu sửa bài IELTS Writing Task 1
> Mẫu sửa bài IELTS Writing Task 2
Nào hãy lựa chọn 1 trong các chủ đề bên dưới để bắt đầu làm bài nhé

The charts below show the world traffic volume measured in passenger-kilometre-miles.
Summarise the information by selecting and reporting the main features, and make comparisons where relevant.